
Waste Production and Consumables
Waste Production
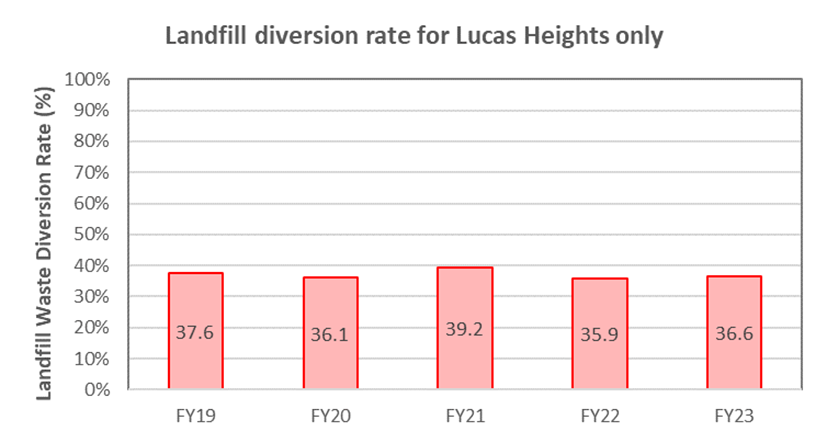
- There has been an overall increase in the amount of waste being generated, however the landfill diversion rate remains relatively stable.
- ANSTO continues to identify new ways to reduce and divert waste away from landfill. Waste diversion options employed at ANSTO include:
- Paper and cardboard recycling
- Co-mingled plastics and glass recycling
- Metal recycling – further broken down into ferrous, non-ferrous and specialties
- Battery recycling
- E-waste
- Garden green waste
- On-site composting
- Fluorescent tube recycling
- Chemical waste recycling
Waste production table (FY2022 vs FY2023)
Landfill and Recycled Waste | Units | FY2022 | FY2023 | Change on previous year (%) |
|---|---|---|---|---|
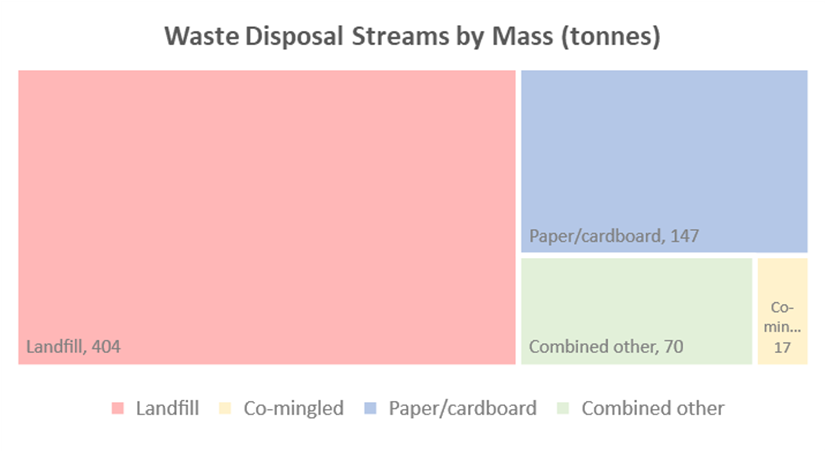
Waste sent to landfill | t | 345 | 404 | 17 |
| t/FTE | 0.295 | 0.343 | 17 |
Recycled cardboard + paper | t | 141 | 147 | 4 |
| t/FTE | 0.120 | 0.125 | 4 |
Recycled co-mingled containers | t | 18.7 | 16.5 | -12 |
| t/FTE | 0.016 | 0.014 | -12 |
Other reuse/recycled streams | t | 34 | 70.2 | 106 |
| t/FTE | 0.028 | 0.058 | 105 |
Landfill diversion rate | % | 35.9 | 36.6 | 0.7 |

Waste disposal streams by mass (tonnes)

Relative waste disposal rate For Lucas Heights only

Landfill diversion rate for Lucas Heights only
Consumables
- ANSTO actively works with its suppliers to reduce the amount of product packaging waste and to enable end-of-life repurposing, reuse or recycling outcomes.
- Where practicably safe to do so, ANSTO supplies its commercial health products to customers using reusable or recyclable packages and containers.
Consumables tables (FY2022 vs FY2023)
Consumables | Units | FY2022 | FY2023 | Change on previous year (%) |
|---|---|---|---|---|
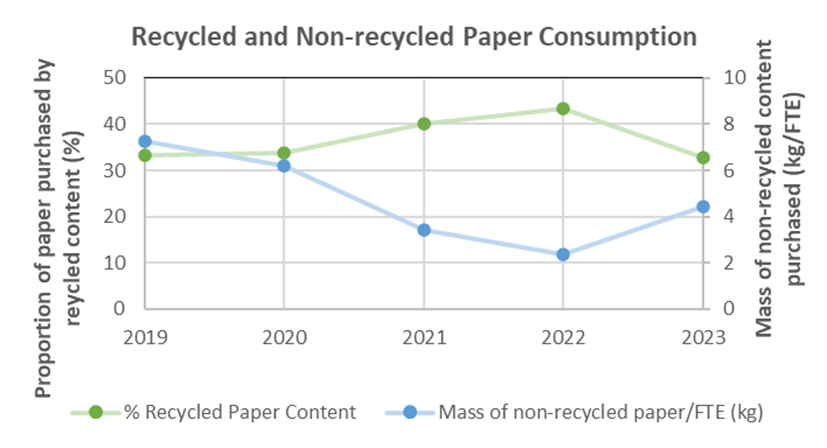
Recycled paper use | Average %recycled paper consumed | 43.3 | 32.9 | -24 |
| kg non-recycled paper consumed/FTE | 2.39 | 4.43 | 85 |
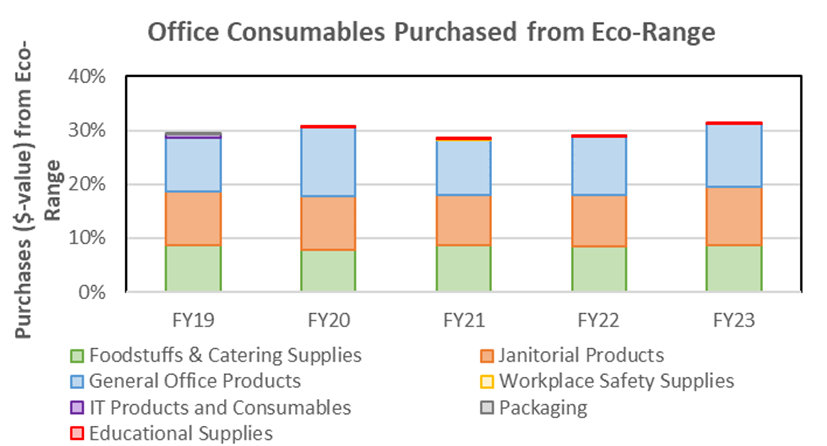
General Office Consumables Purchased from Eco-range | % | 29.0 | 31.4 | 2.4 |

Recycled and Noon-recycled Paper Consumption

Office Consumables Purchased from Eco-range
- Australia has been experiencing paper shortages through FY2023, which has substantially impacted the normal availability of recycled-content paper. This has been reflected in a decrease of 24% in the proportion of recycled-content paper being consumed compared to FY2022. ANSTO will investigate opportunities to increase the proportion of recycled content in FY2024.
- ANSTO continues to reduce the overall paper consumed and the increase the proportion of that paper which is sourced from recycled paper. This has been achieved through several digitisation delivery projects, the introduction of PaperCutTM to track where and how much paper ANSTO staff are printing and driving initiatives throughout the business to procure paper with minimum recycled content rates.
- Through ANSTO’s Whole of Australian Government general office consumables provider, ANSTO encourages staff to purchase items from the available eco-range.
Legend
| kg | kilogram |
|---|---|
| FTE | Full-time equivalent staff attendance |
| t | tonne |
| t/FTE | tonnes per full-time staff equivalent attendance |