Radiation Monitoring
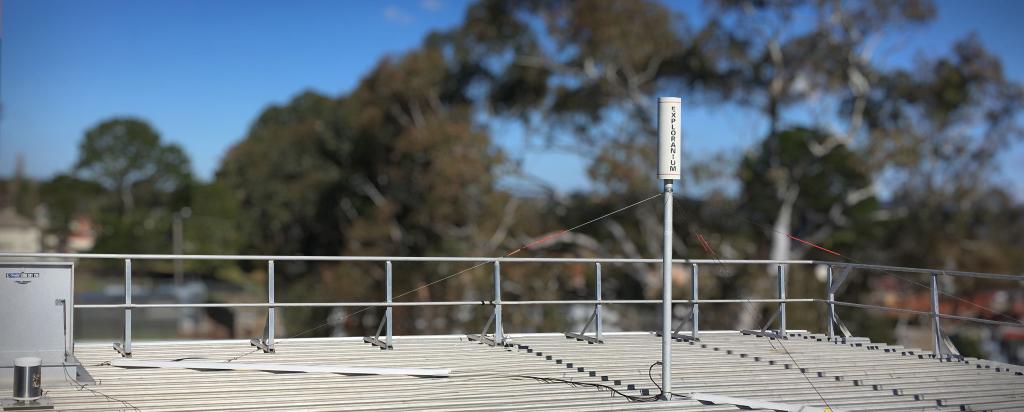
Environmental radiation levels are monitored at a station in Engadine and the data is published online every 15 minutes. Rainfall data from Engadine is shown as the radiation dose can increase during rainfall periods.
Environmental gamma radiation is also measured by dosimeters around the Lucas Heights site and in the local area.
View the environmental radiation and rainfall data from Engadine using the interactive graphs below.
Frequently-asked questions
What is gamma radiation?
Gamma radiation is a penetrating form of ionising radiation, with a short wavelength, similar to X-rays.
What does the unit nGy mean?
The environmental radiation measurements are in nanoGray (nGy), which are units of absorbed radiation dose commonly used in environmental monitoring. A nanoGray is one billionth (one thousand millionth) of a Gray. The environmental radiation dose rate is given as nGy/hour absorbed dose in air. Generally, the dose rate at Engadine is a very small amount from natural background radiation (30-40 nGy/h). For comparison, eating a banana (which contains potassium) will provide you with a dose of 100nGy.
Why is rainfall shown with radiation?
A temporary rise in environmental radiation is often detected when it rains. This occurs because rain affects the behaviour of naturally occurring radionuclides, such as the gas radon. These radionuclides can be absorbed by raindrops and temporarily concentrated near the ground. Also, radon naturally builds up in air spaces in the soil and can be released when rain soaks into the ground.
Will there be higher radiation during calibration checks?
Annual calibration checks are needed to ensure the instruments are working properly and reporting accurate data. During these checks a small radiation source is placed on top of the detector and a rise in environmental radiation may be seen on the graph. A notification will be shown when these calibrations are occurring.